Cegid Allmybanks gives you a decision-making assistance tool which promotes more effective internal communication and allows you to contribute to strategic decisions.
Reports that can be configured to help you solve your specific problems
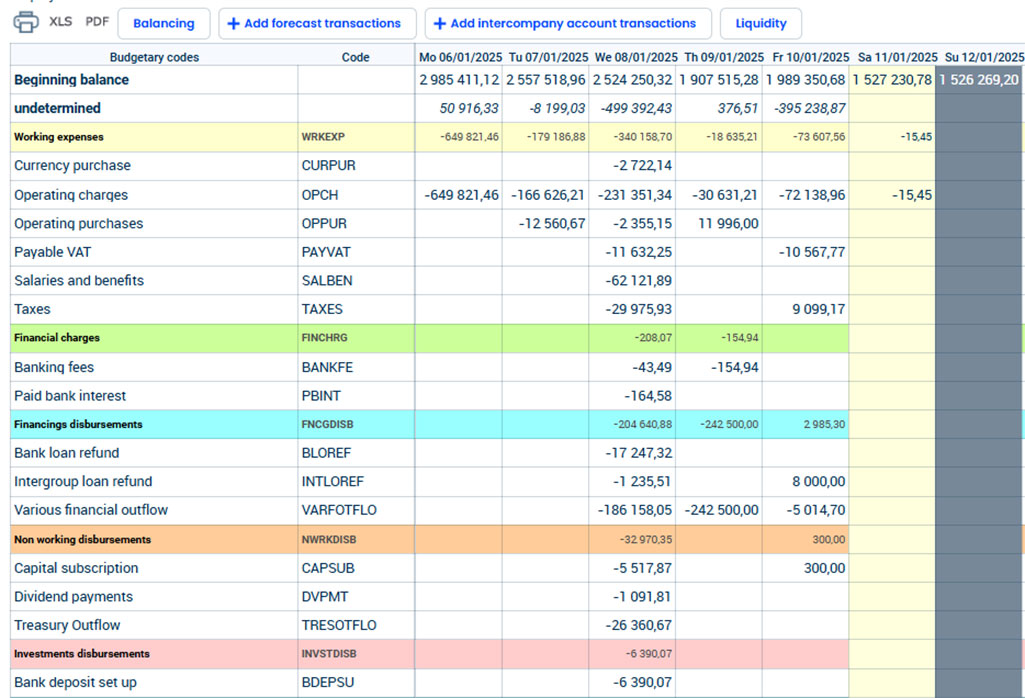
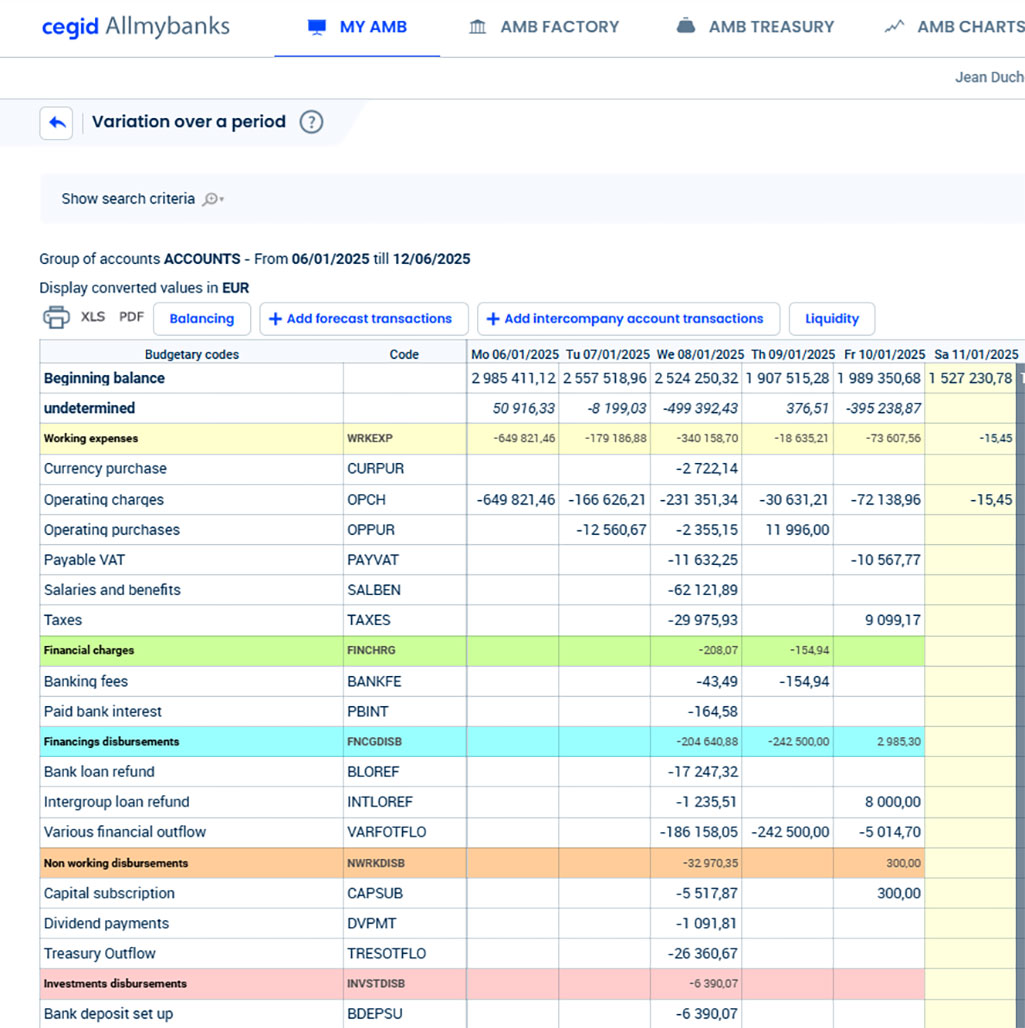
With Cegid Allmybanks, you can create management reports (chart or statement of figures) with a structure that can be configured by group of accounts, grouping of group of accounts, budgetary code or transaction type.
This means that Cegid Allmybanks does not limit the organisational capabilities of your management reports.
To save you time and speed up your daily processing, you can save macro-commands that enable you to generate your most frequent reports in assisted mode.
These statements allow for analysis by currency or consolidated analysis in the currency of your choice. The balances and transactions displayed are refreshed dynamically (flows, forecasts, debts, exchange rates, prices, etc.) so that all authorised users can benefit from real-time information.
Precise statistical management reports
Using the reports available in Cegid Allmybanks, you can analyse:
Variations in balances by budgetary code and transaction type
Average liabilities of bank accounts or internal accounts
Loans by holder (by debt type or term of loan)
Summarised statements by financial instrument
Group net situation reports
Distribution of banking income and charges and fees
Daily records
Intuitive set-up
Automates reporting tasks
Data updated in real time
Group-wide communication tool
Dashboards with charts show you the situation at a glance
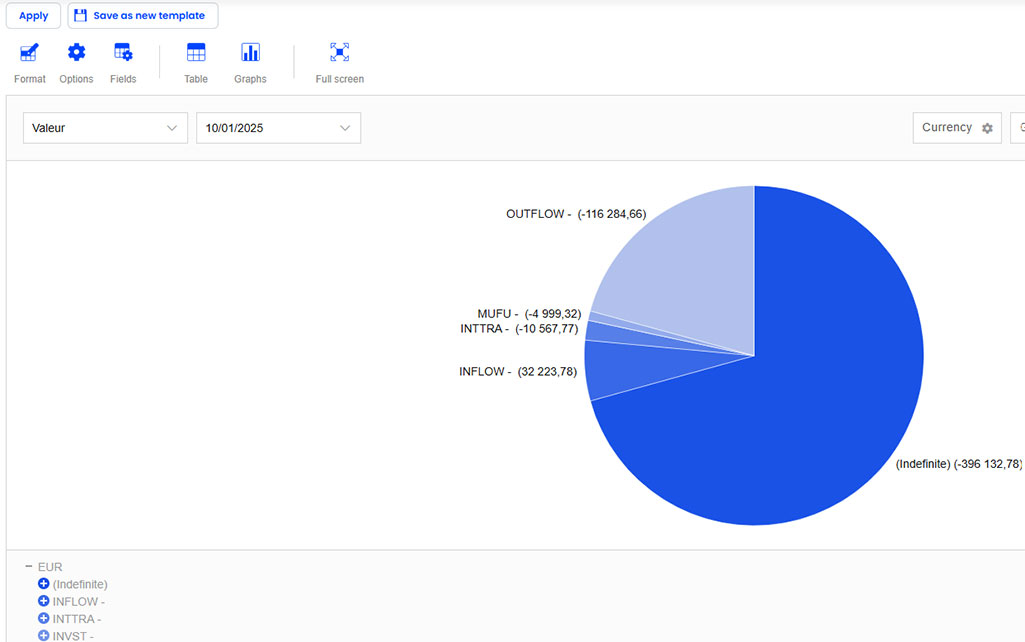
Alongside statistical reports, Cegid Allmybanks allows you to analyse your data using charts and graphs such as histograms, line graphs and pie charts, which can be customised by user. Within the dashboards, you are able to save comments relating to each chart or graph.
All dashboards, or each graph separately, can be exported in pdf format or sent by e-mail.
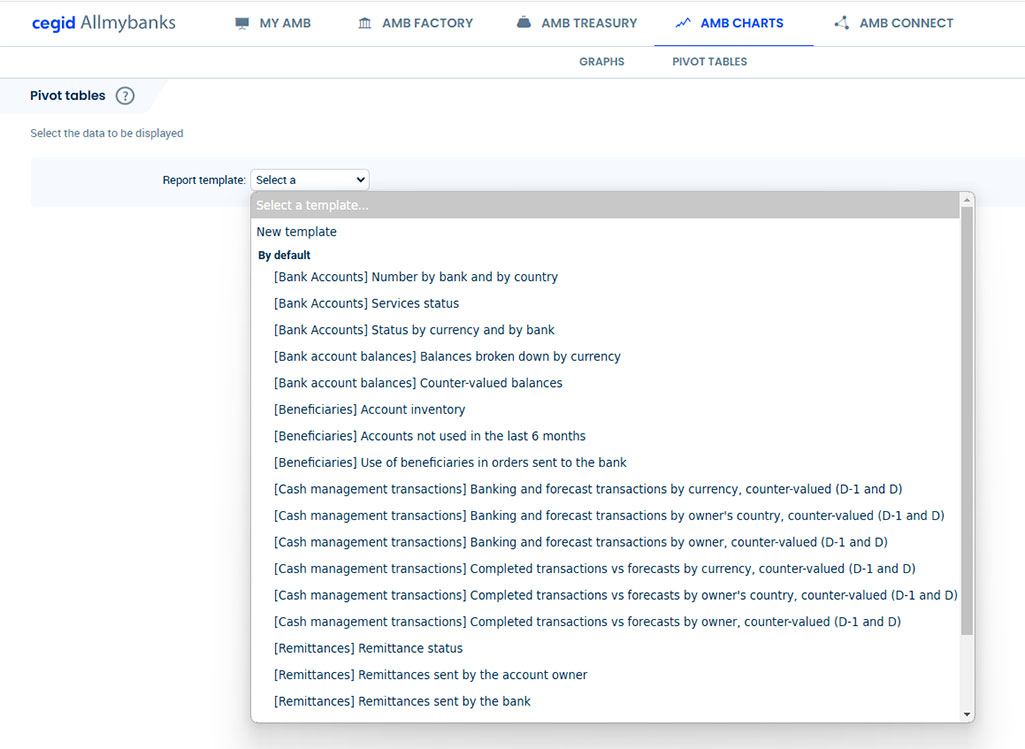
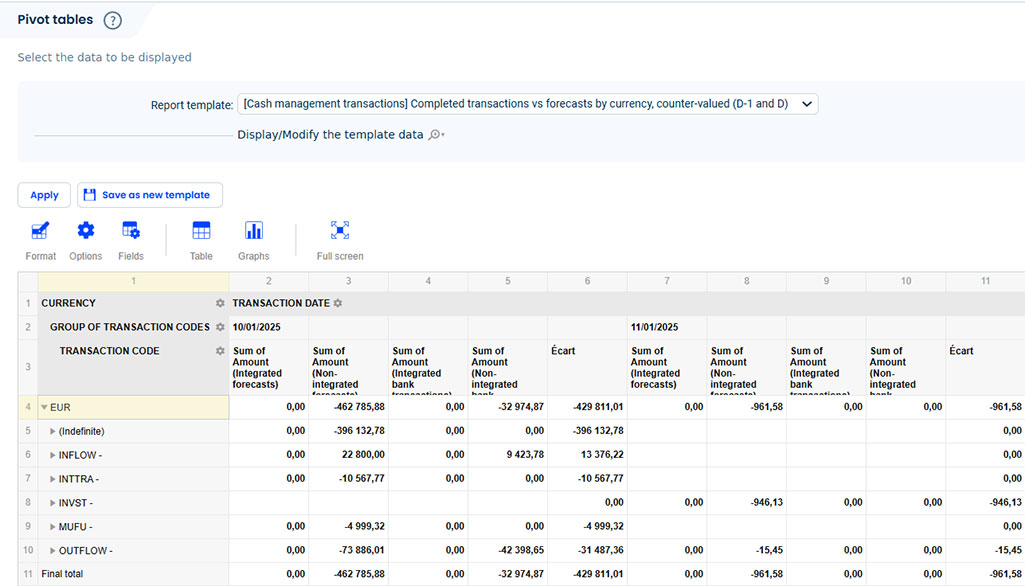
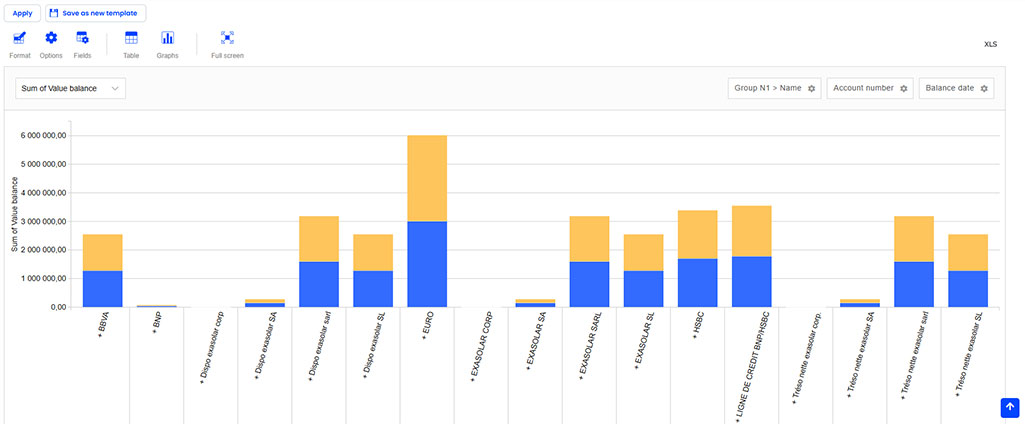
In-depth analysis of your data using pivot tables
With Cegid Allmybanks, you can create dynamic reports based on your data using customizable templates: bank accounts, treasury movements, remittances, beneficiaries, users, etc. The reports generated in the application are displayed as tables or charts (Columns, Bars, Lines, Dispersion, Pie chart, etc.) and can be easily modified.
With dynamic pivot tables, you can quickly synthesize and analyze a set of data from various perspectives.